Facts about Estonia

Facts about Estonia

1. Online selection: In 2005, Estonia was the first country in the world to hold a political election over the internet

2. Craters: Estonia has the highest concentration of meteor craters in the world (the highest number of meteor craters per km2)

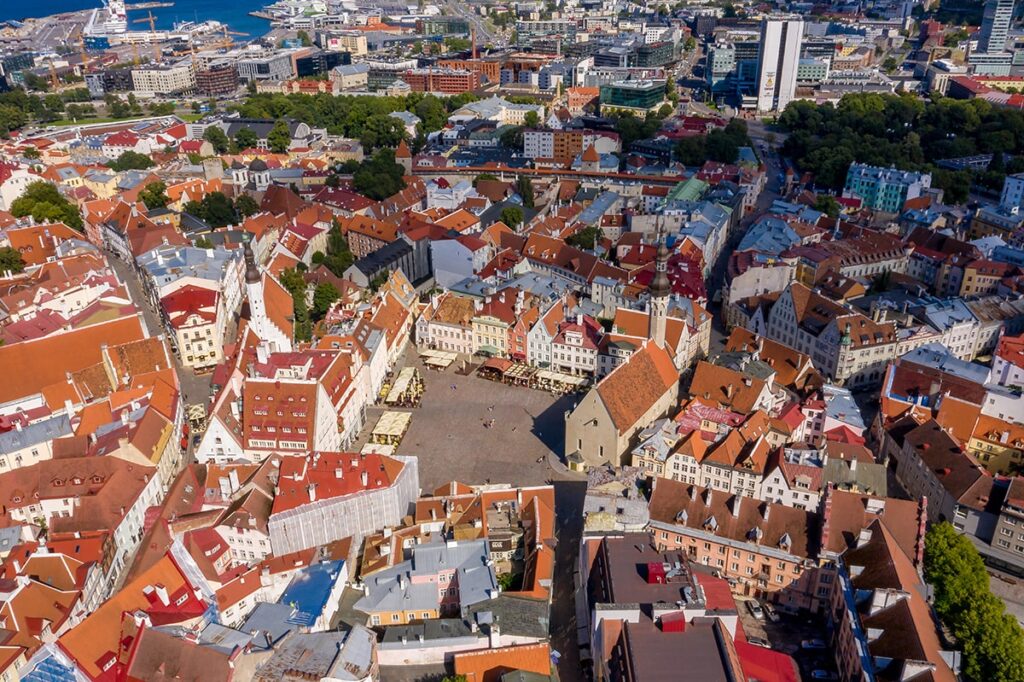
3. Capital cities: Although Tallinn is Estonia’s only official capital, the country is unique in having a number of unofficial capitals, each with their own distinctive characteristics; for example, Tartu is the cultural and intellectual capital, while Pärnu is known as the “summer capital”

4. Two Independence Days: Estonia has two national independence days. Estonia gained independence from Russia on February 24, 1918 and again on August 20, 1991 after 51 years of occupation

5. Least religious country: Estonia is the least religious country in the world; only 16% consider religion important in their daily lives, while a whopping 78% do not consider religion important. The remaining 6% percent either refused to answer or answered ‘don’t know’. The data comes from surveys conducted by Gallup in the years 2006 – 2009

Fact: Kiiking is the name of a sport invented in Estonia in 1996
Attribution: meeky – Flickr.com

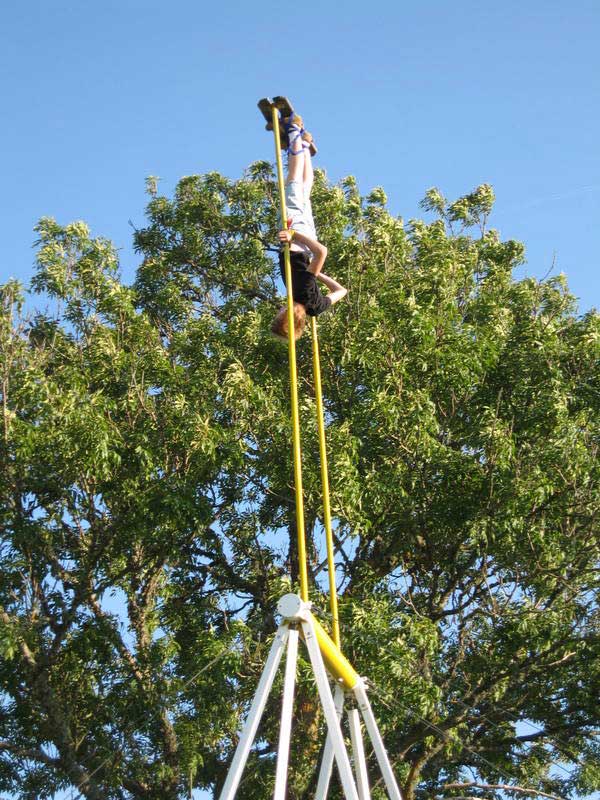
Fact: Kiiking is a sport where the goal is to swing as powerfully as possible. The more force you put into the swing, the longer the arms of the swing become. The record is 7 m and 2 cm


6. Paul Keres: More than 100,000 people attended the funeral of Estonian chess master Paul Keres (1916 – 1975) in 1975

7. Kiiking: Estonian Ado Kosk invented the sport of ‘kiiking’ around 1996. The name of the sport comes from the Estonian word ‘kiik’, meaning ‘swing’ or ‘swing’. The sport involves a large swing that can rotate 360 degrees. The more force you put into the swing, the longer the arms of the swing become. The current record is 7 meters and 2 centimeters, held by Andrus Aasamäe

8. Free transportation: Since 2013, all public transportation in the capital Tallinn has been free. The move was implemented to reduce the number of cars in the city and make life easier for the city’s less fortunate citizens

9. Forests: Around 61% of Estonia is covered in forest, with the most common tree species being pine, spruce and birch

10. Honey: In 1994, Estonia became the first country in Europe to introduce a “flat” tax rate of 26%, which applies to all citizens across all income levels. The new universal tax rate replaced the previous 3 tax rates for personal income and 1 for corporate income. The example was later followed by Lithuania (in 1994) and Latvia (in 1995)

Fact: Estonia has several unofficial capitals
Attribution: cremona daniel + Bernt Rostad + markow76

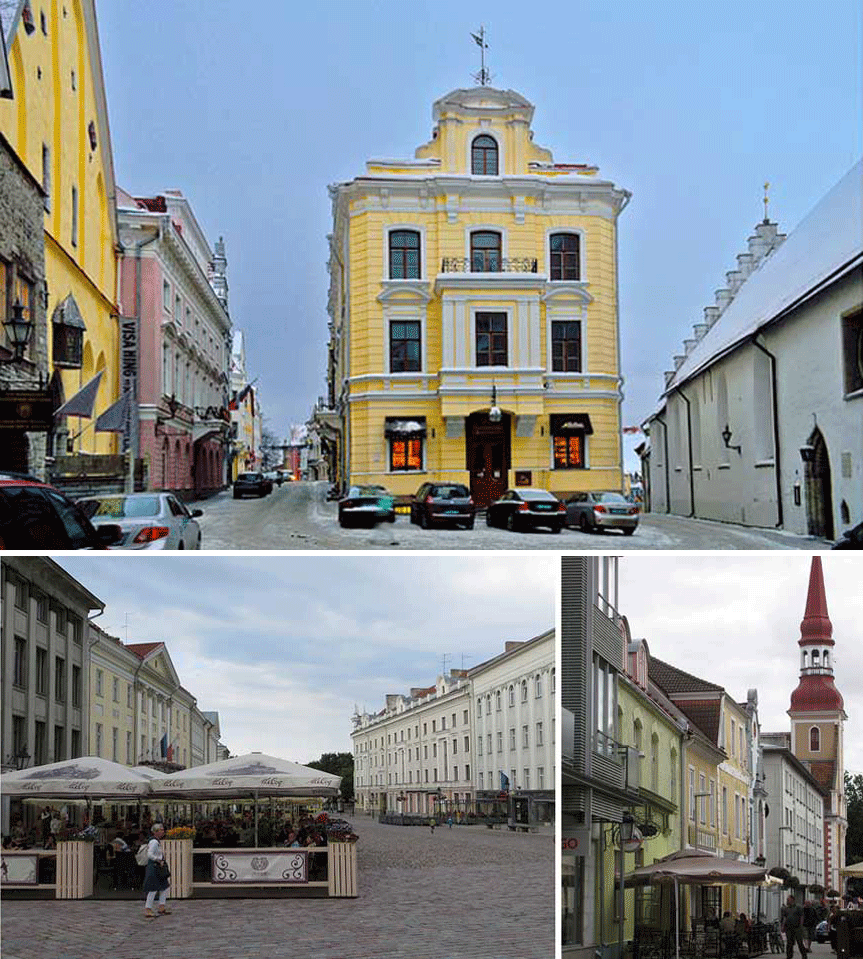
Although Tallinn (top) is the official capital of Estonia, there are several unofficial capitals in the country, including Tartu (left), the intellectual capital, and Pärnu (right), the “summer capital”

Geographic facts

  • Location: Eastern Europe. Between Latvia and Russia with coastline facing the Baltic Sea and the Gulf of Finland
  • Country borders: Latvia (343 km) and Russia (290 km)
  • Coastline: 3,794 km
  • Climate: Coastal climate with wet, moderate winters and cool summers
  • Landscape: Swampy lowlands. Flat in the north and hilly in the south
  • Lowest point: 0 m (Baltic Sea)
  • Highest point: 318 m (Suur Munamagi)
  • Natural resources: Oil shale, peat, rare minerals, phosphates, clay, bryozoan lime, sand, dolomite and arable land
  • Largest city: Tallinn
  • Capital city: Tallinn
  • Total area (square kilometers): 45.340,00 (2021)
  • Land areas (km2): 42.656,57 (2015)
  • Urban areas (km2): 449,97 (2015)
  • Agricultural land (km2): 9.870,00 (2021)
  • Agricultural area (% of total area): 23,09 (2021)
  • Forest area (% of land area): 57,04 (2021)
  • Plant species (higher), endangered: 0,00 (2018)
  • CO2 emissions (metric tons per capita): 5,34 (2020)

Demographic facts

Population

  • Population density (people per km2 total area): 31,13 (2021)
  • Population of largest city: 454.245,00 (2023)
  • Population growth (annual %): 1,28 (2023)
  • Population, total: 1.366.188,00 (2023)
  • Population growth in urban areas (annual %): 1,57 (2023)
  • Population in urban areas (% of total population): 89,48 (2022)
  • Population in rural areas (% of total population): 30,19 (2023)
  • Population growth in rural areas (annual %): 0,61 (2023)
  • Etniske grupper: 68.7% Estonians, 24.8% Russians, 1.7% Ukrainians, 1% Belarusians, 0.6% Finns, 1.6% others and 1.6% unspecified
  • Sprog: 68.5% Estonian (the official language), 29.6% Russian, 0.6% Ukrainian, 1.2% other and 0.1% unspecified
  • Religioner: 9.9% Lutheran, 16.2% Orthodox, 2.2% other Christians (includes Methodists, Seventh Day Adventists, Roman Catholics and Pentecostals), 0.9% other, 54.1% none and 16.7% unspecified
  • Net immigration: -1.000,00 (2023)

Birth and death rates

  • Fertility rate, total (births per woman): 1,41 (2022)
  • Birth rate, gross (per 1,000 inhabitants): 8,60 (2022)
  • Teenage mothers (% of women aged 15-19 who have had children or are pregnant): 10,68 (2020)
  • Death rate, gross (per 1,000 people): 12,80 (2022)
  • Life expectancy at birth, women (years): 82,40 (2022)
  • Life expectancy at birth, men (years): 73,70 (2022)
  • Life expectancy at birth, all (years): 77,94 (2022)
  • Mortality caused by traffic accidents (per 100,000 inhabitants): 4,50 (2019)
  • Mortality, women (per 1,000 adult women): 58,20 (2019)
  • Mortality, male (per 1,000 adult males): 147,04 (2019)
  • Suicide rate, women (per 100,000 women): 6,50 (2019)
  • Mortality, infant (per 1,000 live births): 1,50 (2022)

Work, income and education

  • Wage earners, total (% of total labor force): n/a
  • Income share of the highest 10%: 24,30 (2021)
  • Income share of the lowest 10%: 3,10 (2021)
  • Unemployment, total (% of total labor force): 6,38 (2023)
  • Labor force, total: 752.419,00 (2023)
  • Workforce with basic education (% of the workforce): 37,74 (2023)
  • Labor force with medium education (% of labor force): 70,26 (2023)
  • Number of poor cf. national poverty limits (% of the population): 22,50 (2022)
  • Proportion of the population with moderate or severe food insecurity (%): 8,50 (2021)
  • School enrolments, primary school (gross %): 99,26 (2022)
  • Youth unemployment, all young people (% of total labor force aged 15 - 24): 69,81 (2023)
  • Young people not in education, employment or training, total (% of all young people): 9,60 (2023)
  • Literacy/literacy, total adults (% of population over 15): 99,87 (2021)

    Spending

  • Household (and NPIS) consumption expenditure (US$): 30.405.485.728,91 (2023)
  • Electricity consumption (kWh per inhabitant): 6.732,37 (2014)
  • Inhabitants using the Internet (% of the population): 93,18 (2023)
  • Mobile subscriptions (per 100 people): 155,03 (2022)
  • Number of smokers, total (over 15 years): 29,70 (2020)
  • Alcohol consumption per capita (litres of pure alcohol, expected estimates, +15 years): 17,30 (2023)

Business and tourism

  • Employers, total (% of total labor force): 4,17 (2022)
  • New companies (number of registrations): 20.608,00 (2022)
  • New businesses (new registrations per 1,000 inhabitants aged 15 - 64): 24,32 (2022)
  • Listed companies, total: 14,00 (2003)
  • Business conditions (0 = lowest grade to 100 = highest grade): 1.033,00 (2017)
  • International tourism, number of arrivals: 1.695.000,00 (2020)
  • International tourism, number of departures: 558.000,00 (2020)
  • Railway lines (total route kilometers): 1.033,00 (2017)
  • Railways, number of passengers transported (million passenger-kilometres): 290,00 (2021)

Health

  • Hospital beds (per 1,000 inhabitants): 4,46 (2020)
  • Suicide rate, men (per 100,000 men): 24,30 (2019)
  • Nurses and midwives (per 1,000 inhabitants): 11,18 (2021)
  • Doctors (per 1,000 inhabitants): 3,86 (2020)
  • Prevalence of HIV, total (% of population aged 15 - 49): 165,86 (2023)

Facts Estonia's economy

GDP and GNI

  • BNP (US$): 80,62 (2019)
  • GDP growth (annual %): 40.744.848.827,95 (2023)
  • GDP per capita (US$): -3,01 (2023)
  • GDP, KPP (US$): 29.823,75 (2023)
  • BNI (US$): 66.932.475.061,81 (2023)
  • GNI growth (annual %): 39.377.296.254,03 (2023)
  • Gross savings (% of GDP): -1,39 (2022)

Inflation, interest rates and consumer prices

  • Deposit rate (%): 13,76 (2021)
  • Lending rate (%): 38,00 (2019)
  • Inflation, consumer prices (annual %): 9.089.541.989,21 (2023)
  • Consumer Price Index (2010 = 100): 165,86 (2023)

Trade and production

  • Trade (% of GDP): 156,16 (2023)
  • Vareeksport (US$): 19.669.000.000,00 (2023)
  • Vareimport (US$): 22.963.000.000,00 (2023)
  • Food exports (% of merchandise exports): 11,67 (2023)
  • Food imports (% of goods imports): 12,55 (2023)
  • Food Production Index (2004 - 2006 = 100): 105,65 (2022)
  • Index of animal production (2004 - 2006 = 100): 94,58 (2022)

Industry

  • Industry (including construction), value added (% of GDP): 23,29 (2023)
  • Industry (including construction), value added (US$): 22,31 (2023)
  • Industry, value added (% of GDP): 12,71 (2023)
  • Industry, value added (US$): 5.179.065.878,11 (2023)

Military

  • Armed forces, total: 7.000,00 (2020)
  • Military expenditure (% of GDP): 2,09 (2022)
  • Military Expenditure (US$): 810.916.556,58 (2022)

Others

  • Current health expenditure (% of GDP): 13,76 (2021)
  • Labor tax and contribution (% of company profit): 9,16 (2023)
  • Development Assistance (ODA) received per capita (US$): 0,16 (2017)
  • Social contributions (% of income): 19,54 (2022)